Grab Reports First Quarter 2024 Results
Grab Holdings Limited (NASDAQ: GRAB) today announced unaudited financial results for the first quarter ended March 31, 2024.

- Revenue grew 24% year-over-year, or 29% on a constant currency basis to $653 million
- On-Demand GMV grew 18% year-over-year, or 21% on a constant currency basis to $4.2 billion
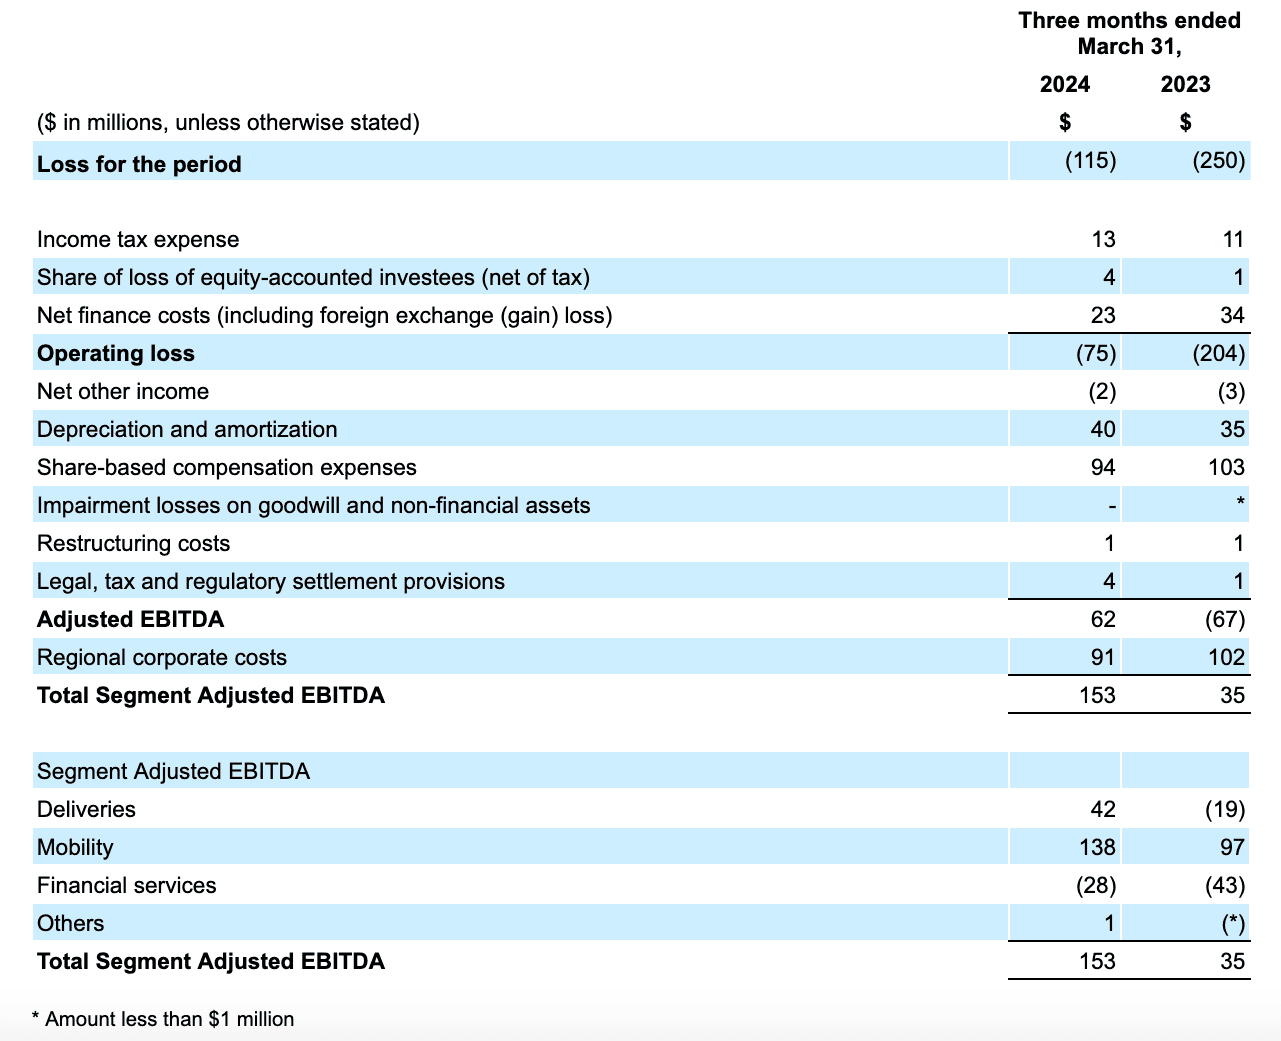
- Operating Loss improved by $129 million year-over-year to $(75) million
- Adjusted EBITDA improved by $129 million year-over-year to an all-time high of $62 million
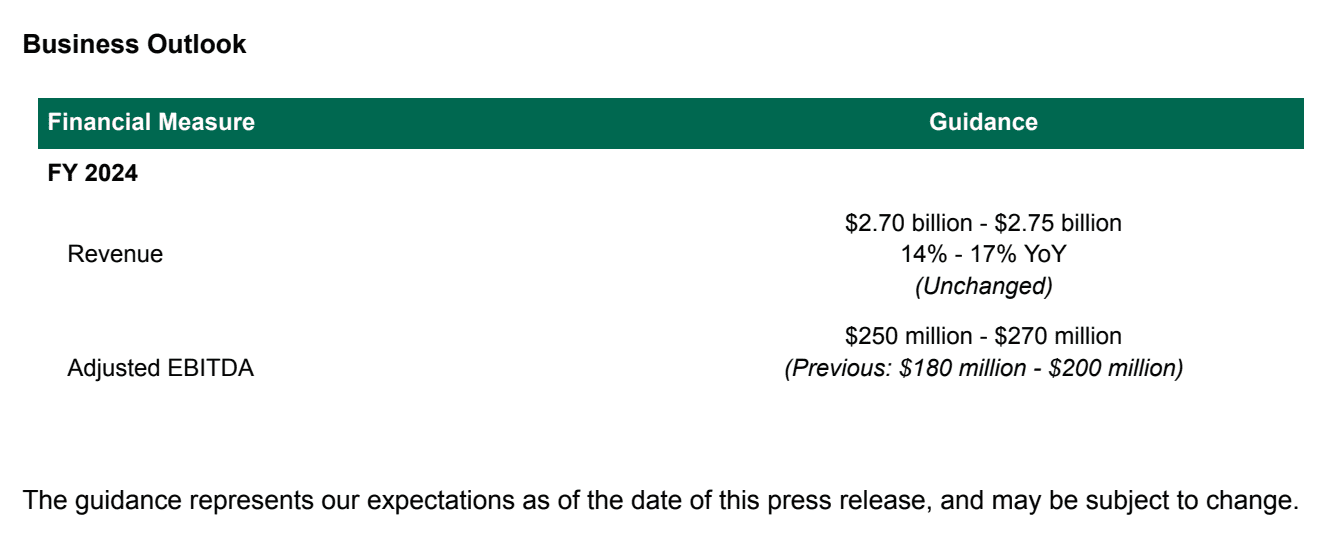
- 2024 Adjusted EBITDA guidance raised to $250 – $270 million from $180 – $200 million previously
SINGAPORE, May 16, 2024 – Grab Holdings Limited (NASDAQ: GRAB) today announced unaudited financial results for the first quarter ended March 31, 2024.
“Our focus on product-led growth is bearing fruit, with On-Demand GMV scaling to new highs in spite of the seasonal impact we usually see in the first quarter of the year. Our push on affordability and reliability is pulling more people onto our platform and driving up order frequency. We also continue to see our partner earnings trending up,” said Anthony Tan, Group Chief Executive Officer and Co-Founder of Grab. “We continue to strengthen our category position and we will leverage this scale and our technological edge to serve our users and partners better.”
“We continued to drive sustained revenue and profitability growth in the first quarter, as we achieved another record for Adjusted EBITDA,” said Peter Oey, Chief Financial Officer of Grab. “As we focus on driving growth across our business, we remain focused on continued improvements in profitability as demonstrated by our ninth consecutive quarter of Group Adjusted EBITDA expansion while improving shareholder returns and managing our balance sheet. Pursuant to our $500 million share repurchase program, we have repurchased approximately $97 million worth of Class A ordinary shares in March, and also paid down the remaining $497 million balance of our Term Loan B.”
Changes to Segment Reporting
As announced in the prior quarter, beginning with this first quarter 2024, Grab made a number of reporting changes to align with changes in how we are managing and evaluating the performance of our business and to facilitate comparison with our industry peers.
As part of the segment reporting changes, we have discontinued the reporting of GMV for our Financial Services segment, consistent with our strategic focus on ecosystem transactions and lending for GrabFin and our digital banks, and we limit our GMV reporting to our On-Demand businesses. Additionally, Advertising contributions previously reported within the Enterprise and New Initiatives segment are now reported in the respective Mobility, Deliveries and Financial Services segments in accordance with the relevant Advertising products. Other reporting changes made include a portion of payment transaction revenues and transaction costs (which we refer to as the net cost of funds) and other relevant support costs previously reported in our Financial Services segment that relate to Mobility and Deliveries transactions now being allocated to the respective Mobility and Deliveries segments. Selected regional corporate costs that support our Mobility, Deliveries and Financial Services segments are now also allocated to these respective segments. After the aforementioned reporting updates are made, Grab’s four reporting segments include: Deliveries, Mobility, Financial Services, and Others.
We have provided certain unaudited historical financial data that is on a basis consistent with our revised segment structure in the section headed “Segment Reporting Changes” below. These reporting changes only affect segment allocation of our financial results and do not revise or restate our previously reported consolidated financial statements.
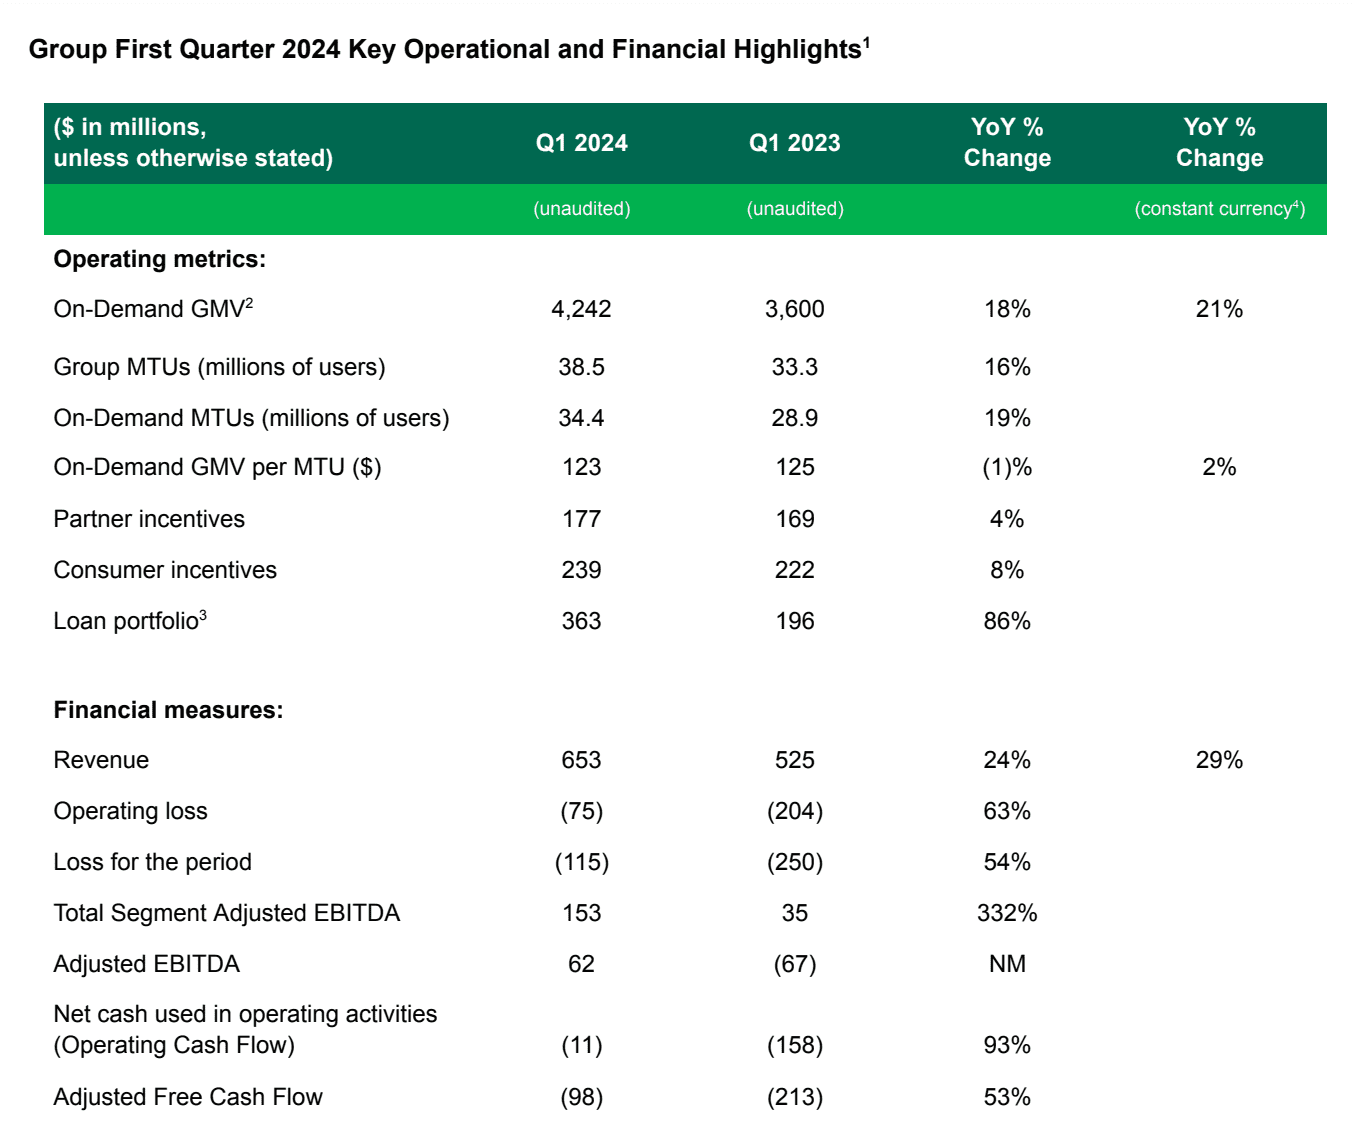
- Revenue grew 24% year-over-year (“YoY”) to $653 million in the first quarter of 2024, or 29% on a constant currency basis[4], driven by revenue growth across all segments amid a reduction in On-Demand incentives as a percentage of On-Demand GMV.
- On-Demand GMV grew 18% YoY, or 21% YoY on a constant currency basis, supported by strong underlying demand growth across Deliveries and Mobility, with On-Demand MTUs growing by 19% YoY, despite seasonal headwinds as a result of the Chinese New Year festivities and the Ramadan fasting period in the first quarter.
- Total incentives were $416 million in the first quarter of 2024, with incentives primarily attributable to the On-Demand segments. On-Demand incentives as a proportion of On-Demand GMV reduced to 9.7% in the first quarter, compared to 10.7% in the same period in 2023, reflecting our focus on reducing our cost to serve while improving the health of our marketplace.
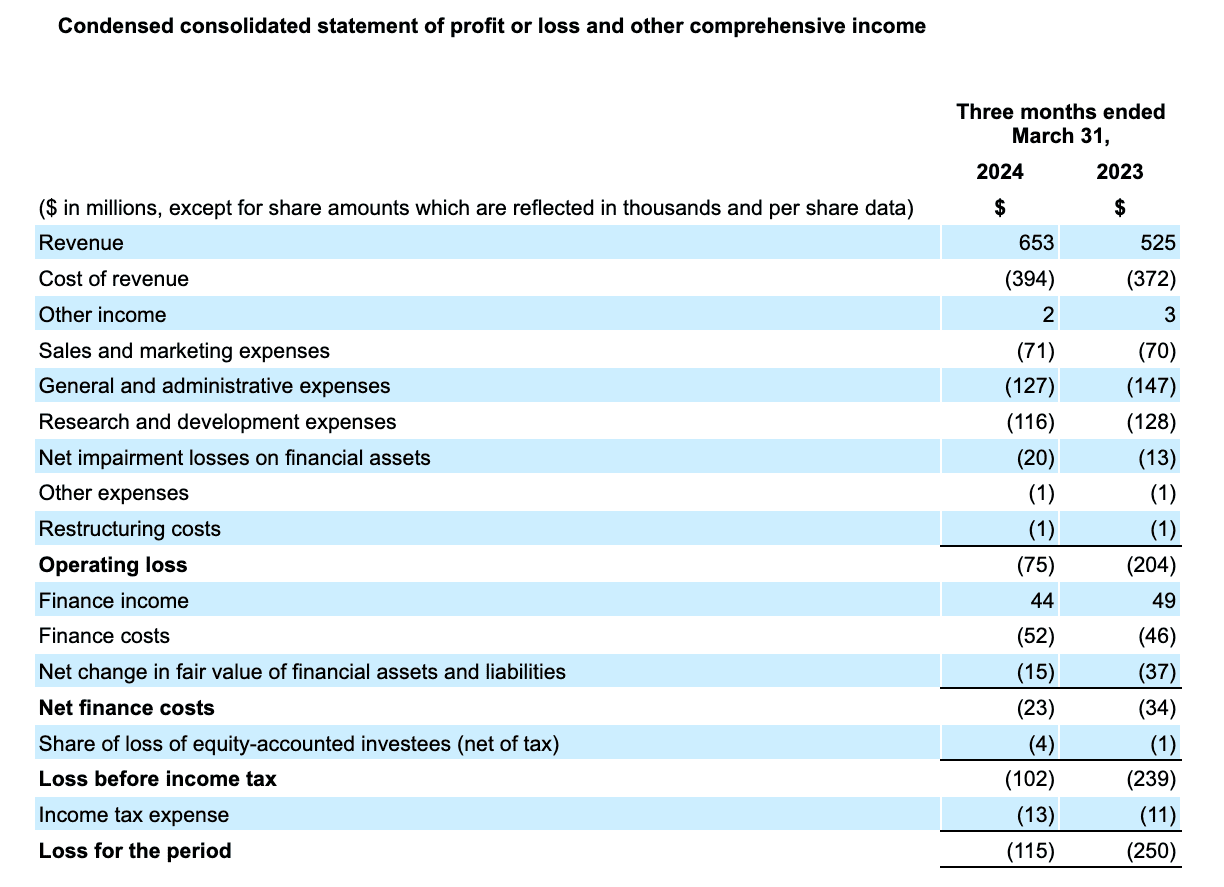
- Operating loss in the first quarter was $75 million, an improvement of $129 million YoY, attributable mainly to improvements in revenue and lower general and administrative expenses.
- Loss for the quarter was $115 million, an improvement of $134 million YoY, primarily due to improvements in Group Adjusted EBITDA, and reductions in net interest expenses and share-based compensation expenses. Our loss for the quarter included a $31 million foreign exchange loss, and $94 million in non-cash share-based compensation expenses.
- Group Adjusted EBITDA was $62 million for the quarter, an improvement of $129 million YoY compared to negative $67 million for the same period in 2023, as we continued to grow On-Demand GMV and revenue, while improving profitability on a Segment Adjusted EBITDA basis and lowering Regional corporate costs5. We also recorded sequential improvements in Group Adjusted EBITDA on a quarter-over-quarter (“QoQ”) basis for nine consecutive quarters.
- Regional corporate costs[5] for the quarter were $91 million, compared to $102 million in the same period in 2023 and $100 million in the prior quarter. We focused on driving cost efficiencies across our organization, with staff costs within regional corporate costs declining 20% YoY, and cloud costs declining 15% YoY.
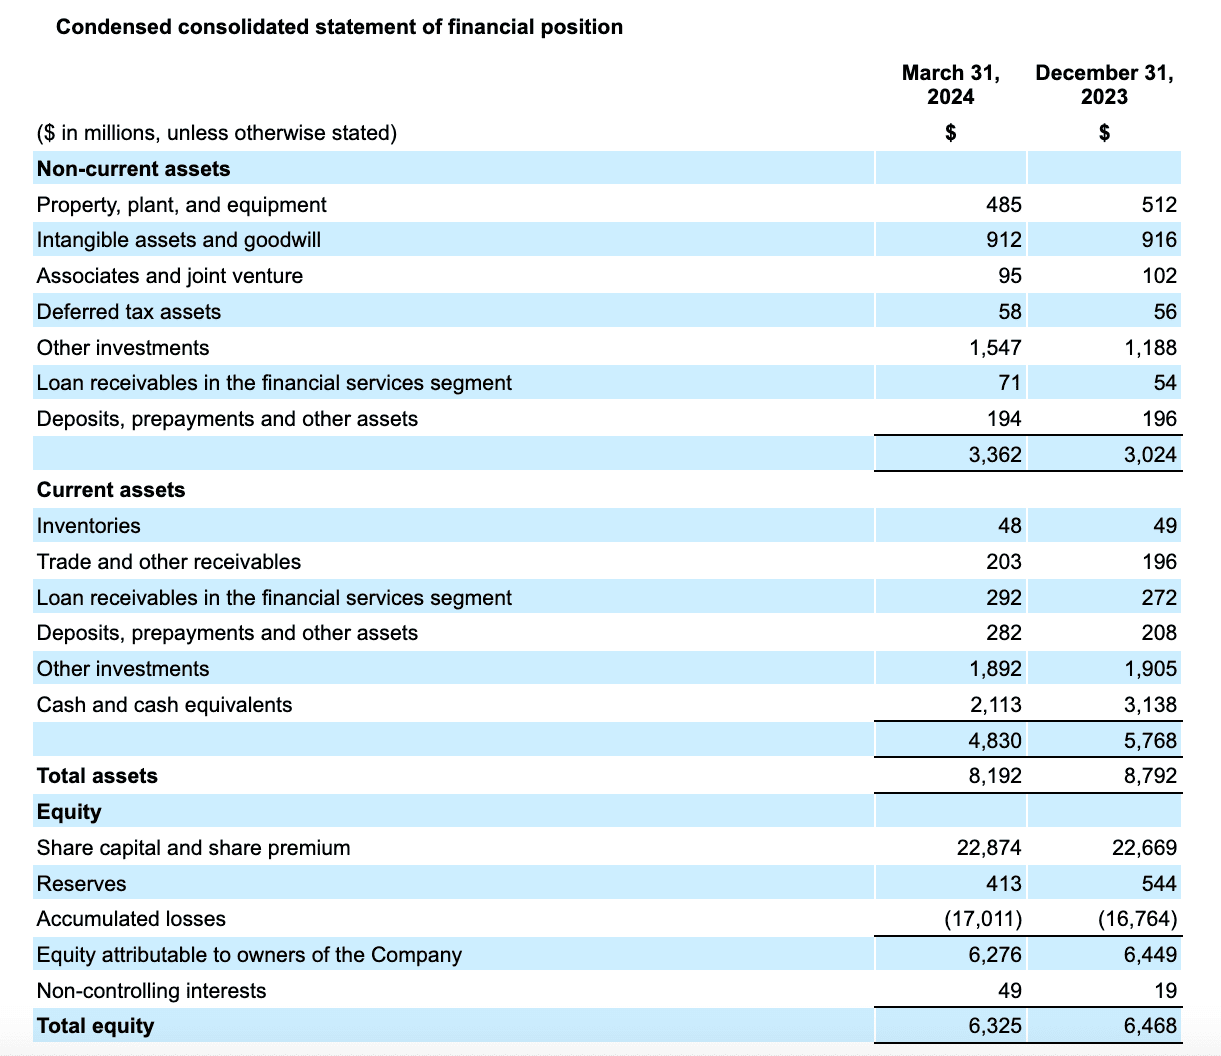
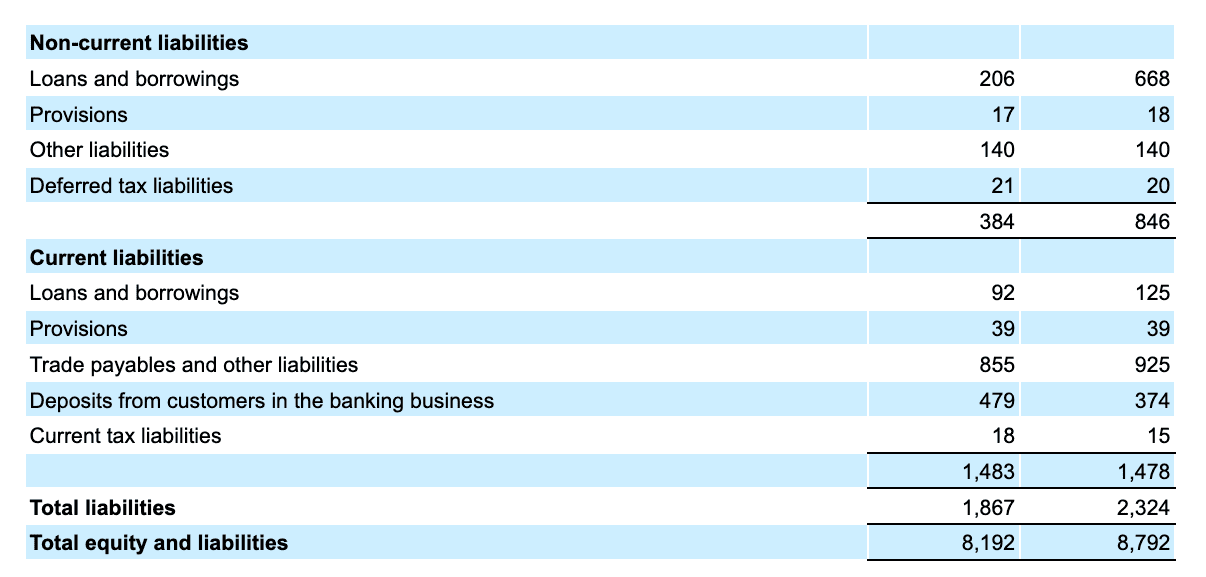
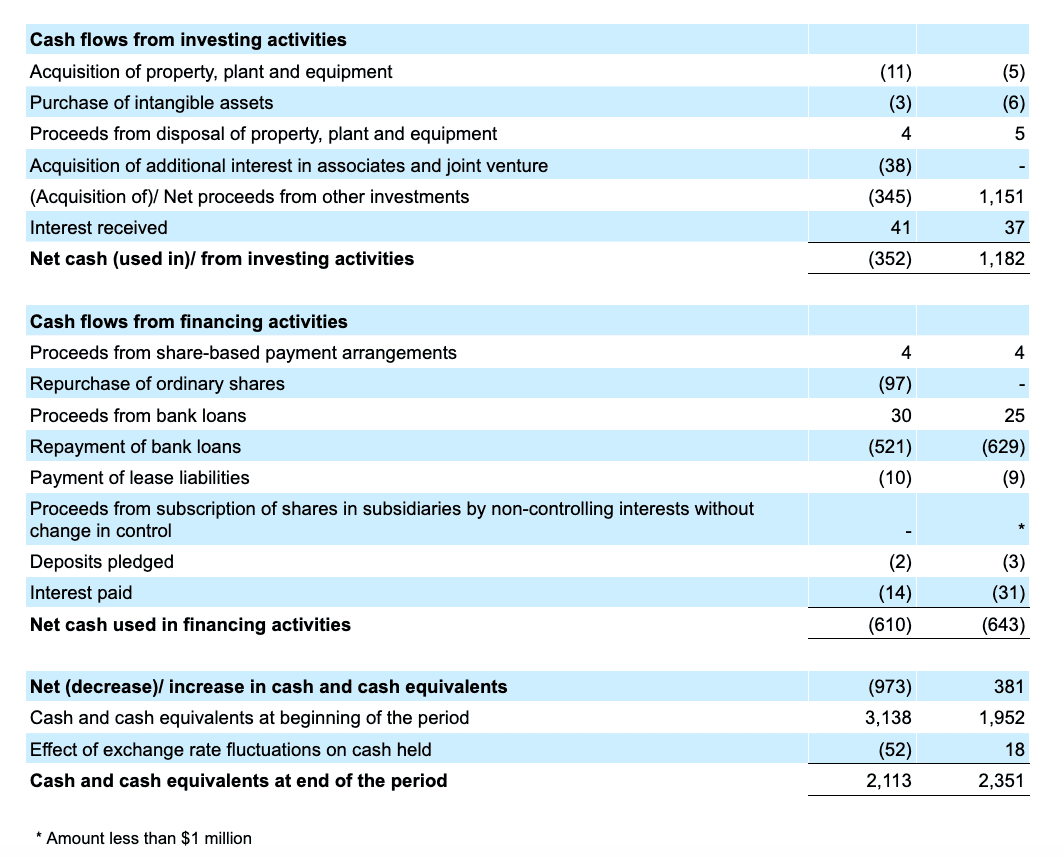
- Cash liquidity[6] totaled $5.3 billion at the end of the first quarter, compared to $6.0 billion at the end of the prior quarter, with a substantial part of the cash outflow attributed to the full repayment of the outstanding principal and accrued interest of our Term Loan B of $497 million, and the repurchase of 30 million shares in the aggregate principal amount of $96.6 million pursuant to our share repurchase program. Our net cash liquidity[7] was $5.0 billion at the end of the first quarter, compared to $5.2 billion at the end of the prior quarter.
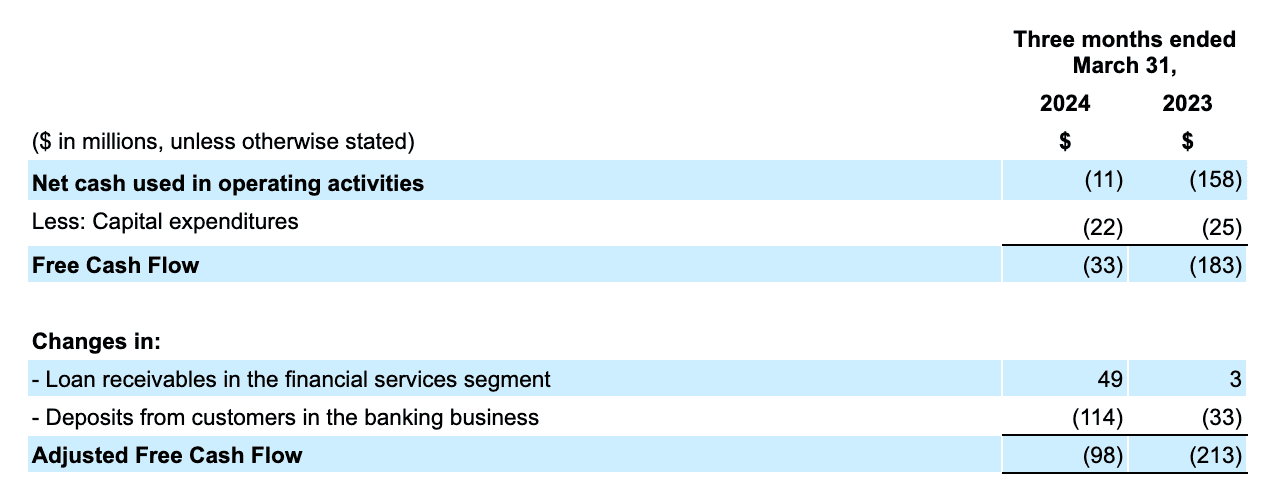
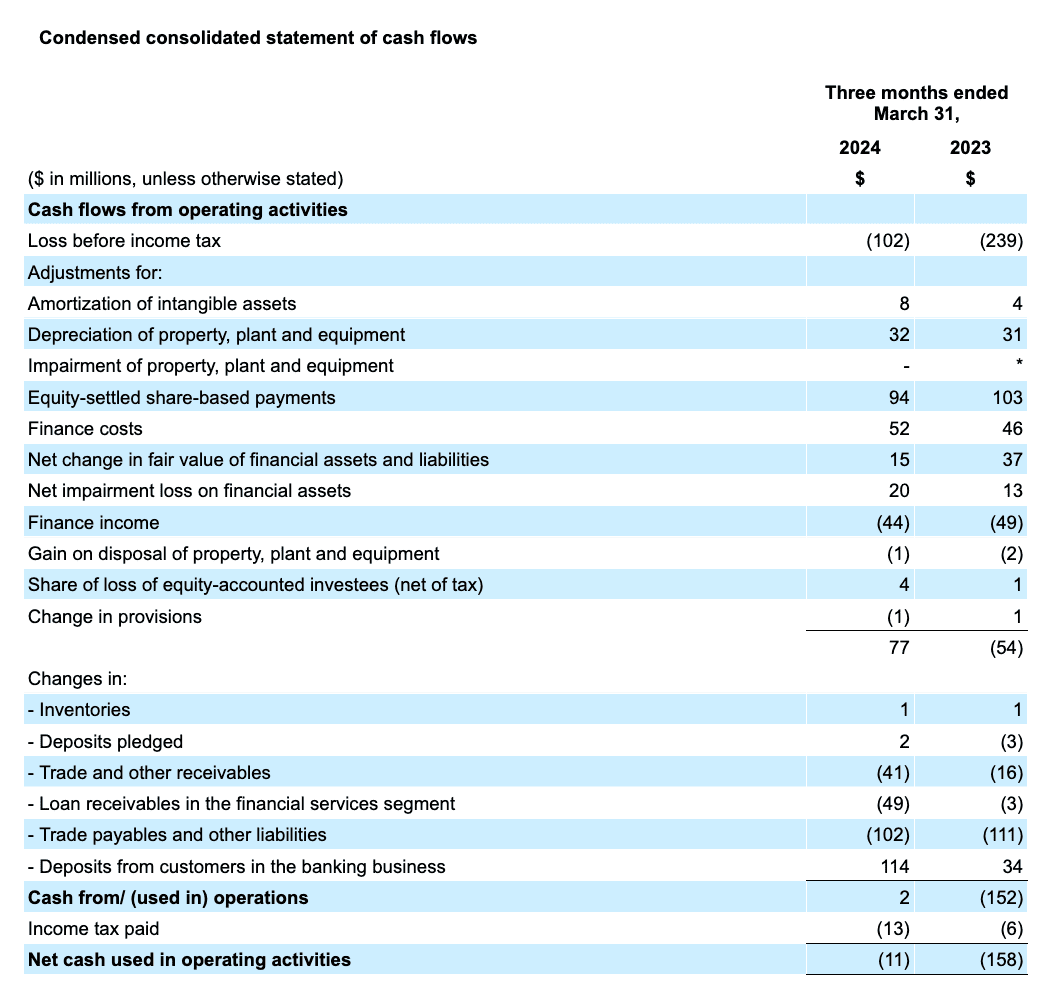
- Net cash used in operating activities was negative $11 million in the first quarter of 2024, an improvement of $147 million YoY, driven by a reduction in loss before income tax. Correspondingly, Adjusted Free Cash Flow was negative $98 million in the first quarter of 2024, driven by the seasonality of payments made during the first quarter, and improved by $115 million YoY on improving profitability.
Segment Financial and Operational Highlights
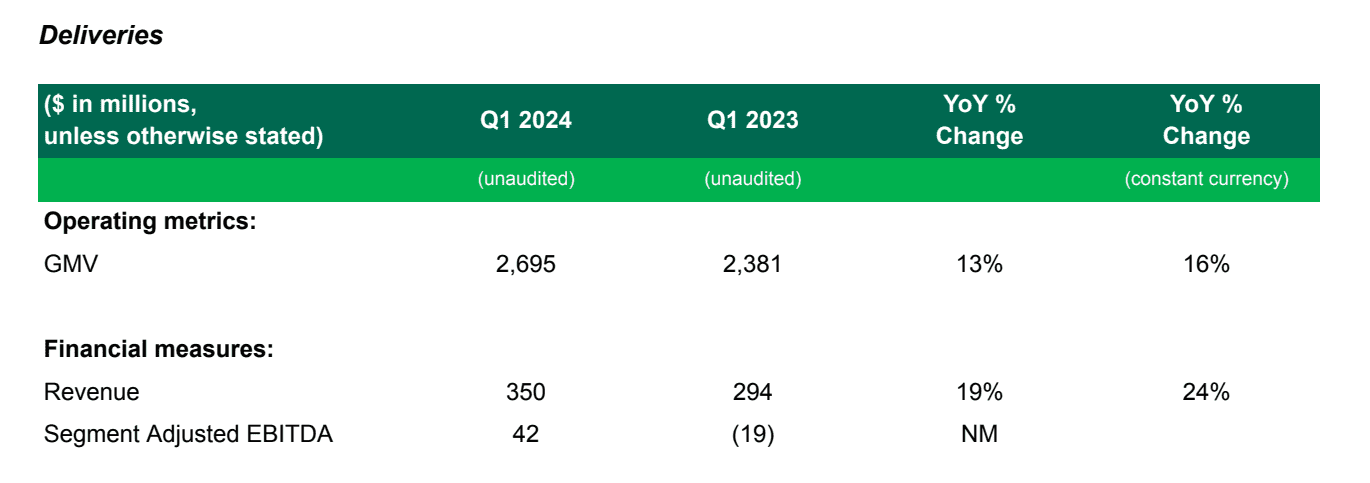
- Deliveries revenue grew 19% YoY, or 24% YoY on a constant currency basis, to $350 million in the first quarter from $294 million in the same period in 2023. The strong growth was primarily attributed to robust GMV growth from Food Deliveries business, as well as growing contributions from Jaya and Advertising businesses.
- Deliveries GMV grew 13% YoY, or 16% YoY on a constant currency basis, to $2,695 million in the first quarter of 2024, underpinned by an increase in transactions, as well as growth in Deliveries MTUs.
- Deliveries segment adjusted EBITDA as a percentage of GMV stood at 1.6% in the first quarter of 2024, compared to negative 0.8% in the first quarter of 2023, amid greater optimization of our incentive spend as a percentage of Deliveries GMV, lowered overhead expenses and increasing contributions from Advertising.
- During the first quarter, the total number of monthly active advertisers who joined our self-serve platform increased 46% YoY to 119,000 while average spend by monthly active advertisers on our self-serve platform increased 54% YoY, as we continued to deepen Advertising penetration among our merchant-partners.
- Adoption of Saver and Priority Deliveries continues to grow. Saver deliveries, which offers users a lower delivery charge in exchange for a longer delivery time and improved batch rates, has seen adoption growing to 26% of Deliveries transactions[8] in the first quarter of 2024, from 23% in the prior quarter.
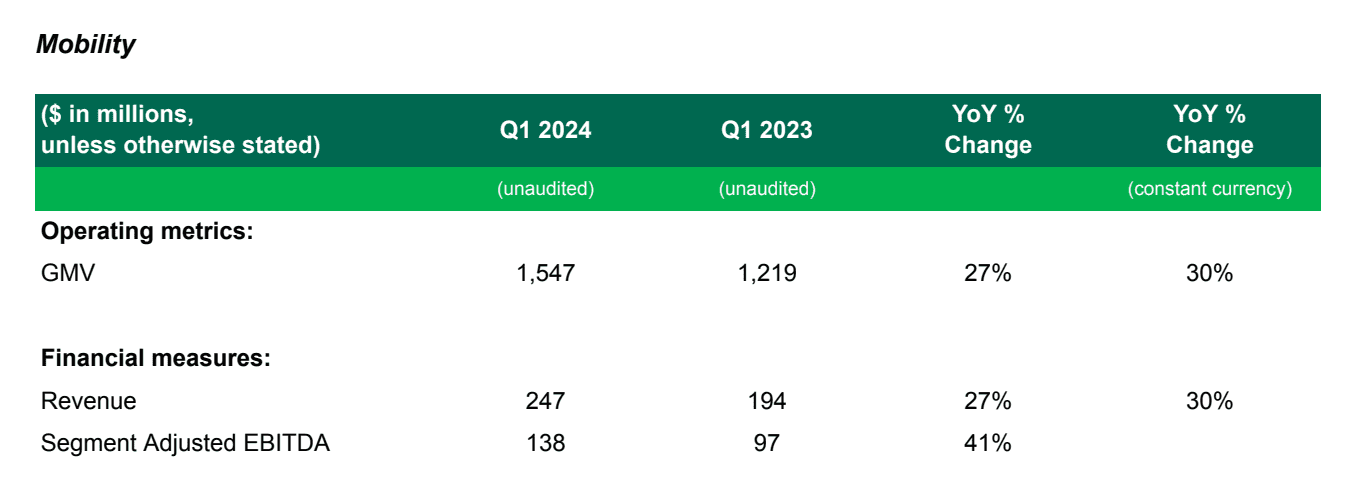
- Mobility revenues continued to grow strongly, rising 27% YoY, or 30% YoY on a constant currency basis, in the first quarter 2024. Growth was broad-based, with positive revenue growth across all of our core markets being driven by continued growth in domestic demand, as well as further growth in inbound international tourist demand.
- Mobility GMV increased 27% YoY, or 30% YoY on a constant currency basis to $1,547 million during the quarter, driven mainly by a 27% YoY growth in Mobility MTUs.
- Mobility segment adjusted EBITDA as a percentage of Mobility GMV was 8.9% in the first quarter of 2024, increasing from 8.0% in the same period last year, attributable to an increase in revenues and optimization of our overhead expenses.
- During the quarter, we continued to increase active driver supply while optimizing our existing driver supply to meet the strong demand growth. In the first quarter of 2024, monthly active driver supply increased by 11% YoY and 2% QoQ, while quarterly active driver retention rates remained healthy at 90%, and average driver earnings per transit hour[9] increased by 9% YoY and 4% QoQ.
- Our efforts to improve driver supply resulted in 622 basis points reduction in the proportion of surged Mobility rides[10] YoY. Underpinned by strong demand levels, Mobility fulfillment rates also improved QoQ.
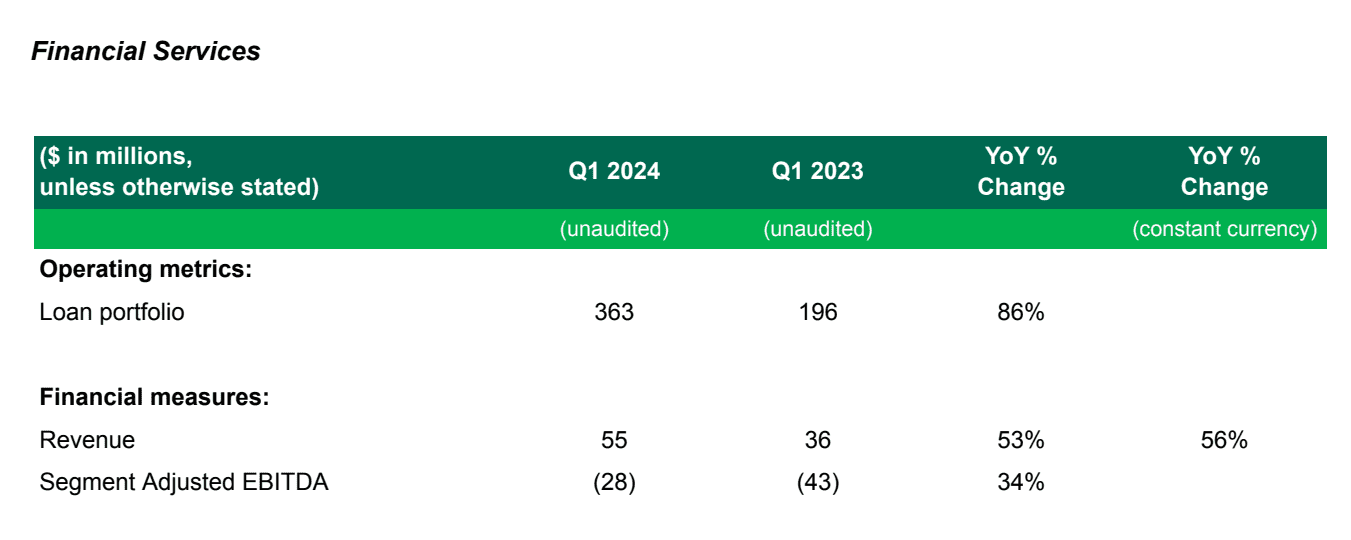
- Revenue for Financial Services grew 53% YoY, or 56% YoY on a constant currency basis, to $55 million in the first quarter of 2024. The YoY growth was driven by increased contributions mainly from lending across GrabFin and Digibank, and improved monetization of GrabFin’s payment services.
- Segment adjusted EBITDA for the quarter improved by 34% YoY to negative $28 million, attributable to the increase in revenues amid growing contributions from higher margin lending activities, coupled with a further reduction in overhead expenses. We continued to streamline our cost base across GrabFin’s businesses, with total operating expenses improving by 15% YoY and 14% QoQ, with the YoY improvement driven by lower staff costs, and further optimization of cost of funds and credit and compliance costs as a percentage of revenues. Total operating expenses for Digibank reduced 23% QoQ, as expenses lowered following the launch of GXBank, our Digibank in Malaysia, in November 2023, but also recorded a 48% YoY increase in total operating expenses due to the launch of GXBank.
- We continued to focus on lending to our ecosystem partners across GrabFin and Digibank, with total loan disbursements during the quarter growing by 64% YoY and 9% QoQ, and loan portfolio ending the quarter at $363 million from $196 million in the same period last year. As of March 31, 2024, around 80% of GXS Bank’s FlexiLoan customers were also Grab users. We remained prudent in our management of credit risk in our loan portfolio, with non-performing loans (more than 90 days past due) at 2% of our loan portfolio.
- Deposits from customers in our Digibank business were $479 million at the end of the first quarter 2024, growing from $36 million in the same period last year and $374 million in the prior quarter. QoQ growth was mainly driven by an increased number of deposit customers for GXBank, our Digibank in Malaysia, which doubled to 262,000 customers as of March, from 131,000 customers at the end of 2023. Notably, over 90% of deposit customers of GXBank are also Grab users.
- Net Cost of Funds, a variable cost that supports the payment platform across our On-Demand and Financial Services segments, and offset by fees earned from payment services, was stable YoY and QoQ at 0.7% of total payments volume[11] in the first quarter of 2024.
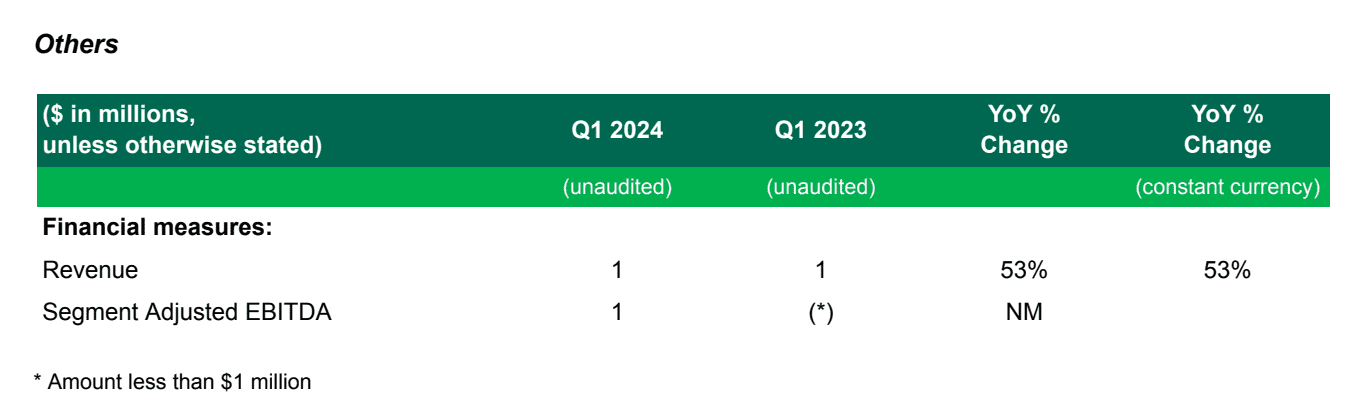
- Revenue for Others grew 53% YoY, to $1 million in the first quarter of 2024, with segment adjusted EBITDA at $1 million in the same period.
About Grab
Grab is a leading superapp in Southeast Asia, operating across the deliveries, mobility and digital financial services sectors. Serving over 700 cities in eight Southeast Asian countries – Cambodia, Indonesia, Malaysia, Myanmar, the Philippines, Singapore, Thailand and Vietnam – Grab enables millions of people everyday to order food or groceries, send packages, hail a ride or taxi, pay for online purchases or access services such as lending and insurance, all through a single app. Grab was founded in 2012 with the mission to drive Southeast Asia forward by creating economic empowerment for everyone. Grab strives to serve a triple bottom line – we aim to simultaneously deliver financial performance for our shareholders and have a positive social impact, which includes economic empowerment for millions of people in the region, while mitigating our environmental footprint.
We use our website as a means of disclosing material non-public information. Such disclosures will be included on our website in the “Investor Relations” section or at investors.grab.com. Accordingly, investors should monitor such sections of our website, in addition to following our press releases, SEC filings and public conference calls and webcasts. Information contained on, or that can be accessed through, our website does not constitute a part of this document and is not incorporated by reference herein.
Forward-Looking Statements
This document and the announced investor webcast contain “forward-looking statements” within the meaning of the “safe harbor” provisions of the U.S. Private Securities Litigation Reform Act of 1995. All statements other than statements of historical fact contained in this document and the webcast, including but not limited to, statements about Grab’s goals, targets, projections, outlooks, beliefs, expectations, strategy, plans, objectives of management for future operations of Grab, and growth opportunities, are forward-looking statements. Some of these forward-looking statements can be identified by the use of forward-looking words, including “anticipate,” “expect,” “suggest,” “plan,” “believe,” “intend,” “estimate,” “target,” “project,” “should,” “could,” “would,” “may,” “will,” “forecast” or other similar expressions. Forward-looking statements are based upon estimates and forecasts and reflect the views, assumptions, expectations, and opinions of Grab, which involve inherent risks and uncertainties, and therefore should not be relied upon as being necessarily indicative of future results. A number of factors, including macro-economic, industry, business, regulatory and other risks, could cause actual results to differ materially from those contained in any forward-looking statement, including but not limited to: Grab’s ability to grow at the desired rate or scale and its ability to manage its growth; its ability to further develop its business, including new products and services; its ability to attract and retain partners and consumers; its ability to compete effectively in the intensely competitive and constantly changing market; its ability to continue to raise sufficient capital; its ability to reduce net losses and the use of partner and consumer incentives, and to achieve profitability; potential impact of the complex legal and regulatory environment on its business; its ability to protect and maintain its brand and reputation; general economic conditions, in particular as a result of currency exchange fluctuations and inflation; expected growth of markets in which Grab operates or may operate; and its ability to defend any legal or governmental proceedings instituted against it. In addition to the foregoing factors, you should also carefully consider the other risks and uncertainties described under “Item 3. Key Information – D. Risk Factors” and in other sections of Grab’s annual report on Form 20-F for the year ended December 31, 2023, as well as in other documents filed by Grab from time to time with the U.S. Securities and Exchange Commission (the “SEC”).
Forward-looking statements speak only as of the date they are made. Grab does not undertake any obligation to update any forward-looking statement, whether as a result of new information, future developments, or otherwise, except as required under applicable law.
Unaudited Financial Information
Grab’s unaudited selected financial data for the three months ended March 31, 2024 and 2023 included in this document and the investor webcast is based on financial data derived from Grab’s management accounts that have not been reviewed or audited.
Certain amounts and percentages that appear in this document may not sum due to rounding.
Non-IFRS Financial Measures
This document and the investor webcast include references to non-IFRS financial measures, which include: Adjusted EBITDA, Segment Adjusted EBITDA, Segment Adjusted EBITDA margin, Total Segment Adjusted EBITDA, Adjusted EBITDA margin and Adjusted Free Cash Flow. Grab uses Adjusted EBITDA, Segment Adjusted EBITDA, Segment Adjusted EBITDA margin, Total Segment Adjusted EBITDA, and Adjusted EBITDA margin for financial and operational decision-making and as a means to evaluate period-to-period comparisons, and Grab’s management believes that these non-IFRS financial measures provide meaningful supplemental information regarding its performance by excluding certain items that may not be indicative of its recurring core business operating results. For example, Grab’s management uses Total Segment Adjusted EBITDA as a useful indicator of the economics of Grab’s business segments, as it does not include regional corporate costs. Adjusted Free Cash Flow excludes the effects of the movement in working capital for our lending and digital banking deposit activities. Grab uses Adjusted Free Cash Flow to monitor business performance and assess its cash flow activity other than its lending and digital banking deposit activities, and Grab’s management believes that the additional disclosure serves as a useful indicator for comparison with the cash flow reporting of certain of its peers.
However, there are a number of limitations related to the use of non-IFRS financial measures, and as such, the presentation of these non-IFRS financial measures should not be considered in isolation from, or as an alternative to, financial measures determined in accordance with IFRS. In addition, these non-IFRS financial measures may differ from non-IFRS financial measures with comparable names used by other companies. See below for additional explanations about the non-IFRS financial measures, including their definitions and a reconciliation of these measures to the most directly comparable IFRS financial measures. With regard to forward-looking non-IFRS guidance and targets provided in this document and the investor webcast, Grab is unable to provide a reconciliation of these forward-looking non-IFRS measures to the most directly comparable IFRS measures without unreasonable efforts because the information needed to reconcile these measures is dependent on future events, many of which Grab is unable to control or predict.
Explanation of non-IFRS financial measures:
- Adjusted EBITDA is a non-IFRS financial measure calculated as profit (loss) for the period adjusted to exclude: (i) net interest income (expenses), (ii) net other income (expenses), (iii) income tax expenses (credit), (iv) depreciation and amortization, (v) share-based compensation expenses, (vi) costs related to mergers and acquisitions, (vii) foreign exchange gain (loss), (viii) impairment losses on goodwill and non-financial assets, (ix) fair value changes on investments, (x) restructuring costs, (xi) legal, tax and regulatory settlement provisions and (xii) share listing and associated expenses. Starting from this earnings release, realized foreign exchange gain (loss) is additionally excluded from Adjusted EBITDA (as compared to only unrealized foreign exchange gain (loss) in previous reports). Grab’s management believes that this change would enhance the comparison of Grab with certain of its peers. Adjusted EBITDA for all periods presented in this earnings release reflect this new definition of Adjusted EBITDA.
- Segment Adjusted EBITDA is a non-IFRS financial measure, representing the Adjusted EBITDA of each of our four business segments, excluding, in each case, regional corporate costs.
- Segment Adjusted EBITDA margin is a non-IFRS financial measure, calculated as Segment Adjusted EBITDA divided by Gross Merchandise Value. For Financial Services and Others, Segment Adjusted EBITDA margin is calculated as Segment Adjusted EBITDA divided by Revenue.
- Total Segment Adjusted EBITDA is a non-IFRS financial measure, representing the sum of Adjusted EBITDA of our four business segments.
- Adjusted EBITDA margin is a non-IFRS financial measure calculated as Adjusted EBITDA divided by Revenue.
- Adjusted Free Cash Flow is a non-IFRS financial measure, defined as net cash flows from operating activities less capital expenditures, excluding changes in working capital related to loans and advances to customers, and deposits from the digital banking business.
We compare the percent change in our current period results from the corresponding prior period using constant currency. We present constant currency growth rate information to provide a framework for assessing how our underlying GMV and revenue performed excluding the effect of foreign currency rate fluctuations. We calculate constant currency by translating our current period financial results using the corresponding prior period’s monthly exchange rates for our transacted currencies other than the U.S. dollar.
Operating Metrics
Gross Merchandise Value (GMV) is an operating metric representing the sum of the total dollar value of transactions from Grab’s products and services, including any applicable taxes, tips, tolls, surcharges and fees, over the period of measurement. GMV includes sales made through offline stores. GMV is a metric by which Grab understands, evaluates and manages its business, and Grab’s management believes is necessary for investors to understand and evaluate its business. GMV provides useful information to investors as it represents the amount of customer spend that is being directed through Grab’s platform. This metric enables Grab and investors to understand, evaluate and compare the total amount of customer spending that is being directed through its platform over a period of time. Grab presents GMV as a metric to understand and compare, and to enable investors to understand and compare, Grab’s aggregate operating results, which captures significant trends in its business over time.
Monthly Transacting User (MTUs) is defined as the monthly number of unique users who transact via Grab’s apps (including OVO, GXS Bank and GXBank), where transact means to have successfully paid for or utilized any of Grab’s products or services (including lending). MTUs over a quarterly or annual period are calculated based on the average of the MTUs for each month in the relevant period. Starting from 2023, MTUs additionally include the monthly number of unique users who transact with Grab offline while recording their Jaya Grocer loyalty points on Grab’s apps. MTUs additionally include the monthly number of unique users who transact via Grab’s apps (including OVO) through group orders, starting from the fourth quarter of 2023, and users who transact via Grab’s apps (including GXS Bank and GXBank), starting from the first quarter of 2024. MTUs is a metric by which Grab understands, evaluates and manages its business, and Grab’s management believes is necessary for investors to understand and evaluate its business.
Partner incentives is an operating metric representing the dollar value of incentives granted to driver- and merchant-partners, the effect of which is to reduce revenue. For certain delivery offerings where Grab is contractually responsible for delivery services provided to end-users, incentives granted to driver-partners are recognized in cost of revenue.
Consumer incentives is an operating metric representing the dollar value of discounts and promotions offered to consumers, the effect of which is to reduce revenue. Partner incentives and consumer incentives are metrics by which we understand, evaluate and manage our business, and we believe are necessary for investors to understand and evaluate our business. We believe these metrics capture significant trends in our business over time.
Loan portfolio is an operating metric representing the total of current and non-current loan receivables in the financial services segment, net of expected credit loss allowances.
Segment Reporting Changes
Beginning with the first quarter 2024 earnings release, Grab reports its segment results as Deliveries, Mobility, Financial Services, and Others:
- Deliveries primarily includes on-demand and scheduled delivery of daily necessities including ready-to-eat meals and groceries, as well as point-to-point package delivery. It also includes offline sales from Jaya Grocer and Advertising contributions.
- Mobility primarily includes rides provided by driver-partners across a wide variety of multi-modal mobility options including private cars, taxis, motorcycles, and shared mobility options such as carpooling. It also includes vehicle rentals for our driver-partners and Advertising contributions.
- Financial services primarily includes digital payments, lending, insurance distribution, and digital banking services in Singapore and Malaysia.
- Others is a combination of multiple operating businesses that are not individually material.
These reporting changes were made to align with changes in how we are managing and evaluating the performance of our business and to facilitate comparison with our industry peers.
As part of the segment reporting changes, we have discontinued the reporting of GMV for our Financial Services segment, consistent with our strategic focus on ecosystem transactions and lending for GrabFin and our digital banks, and we limit our GMV reporting to our On-Demand businesses. Additionally, Advertising contributions previously reported within the Enterprise and New Initiatives segment are now reported in the respective Mobility, Deliveries and Financial Services segments in accordance with the relevant Advertising products. Other reporting changes made include a portion of payment transaction revenues and transaction costs (which we refer to as the net cost of funds) and other relevant support costs previously reported in our Financial Services segment that relate to Mobility and Deliveries transactions now being allocated to the respective Mobility and Deliveries segments. Selected regional corporate costs that support our Mobility, Deliveries and Financial Services segments are now also allocated to these respective segments. After the aforementioned reporting updates are made, Grab’s four reporting segments include: Deliveries, Mobility, Financial Services, and Others.
In conjunction with these reporting changes, certain prior year amounts have been recast to conform to the new segment reporting structure. These reporting changes have no impact on previously reported consolidated statements of financial position, statement of profit or loss and other comprehensive income, statement of changes in equity or statement of cash flows.
The following table presents our On-Demand GMV, revenues and Adjusted EBITDA (in $ millions, unaudited):
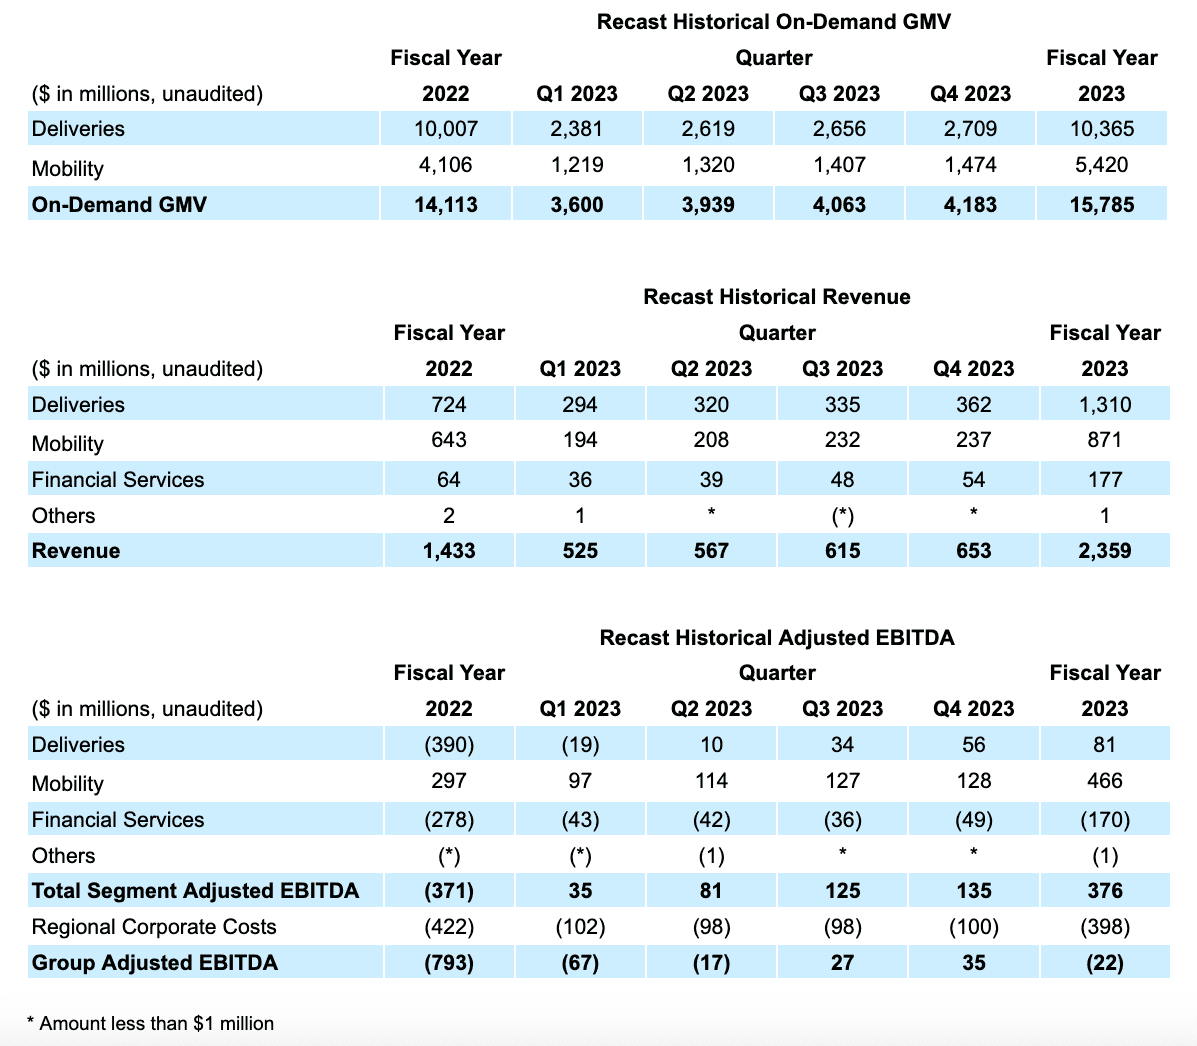
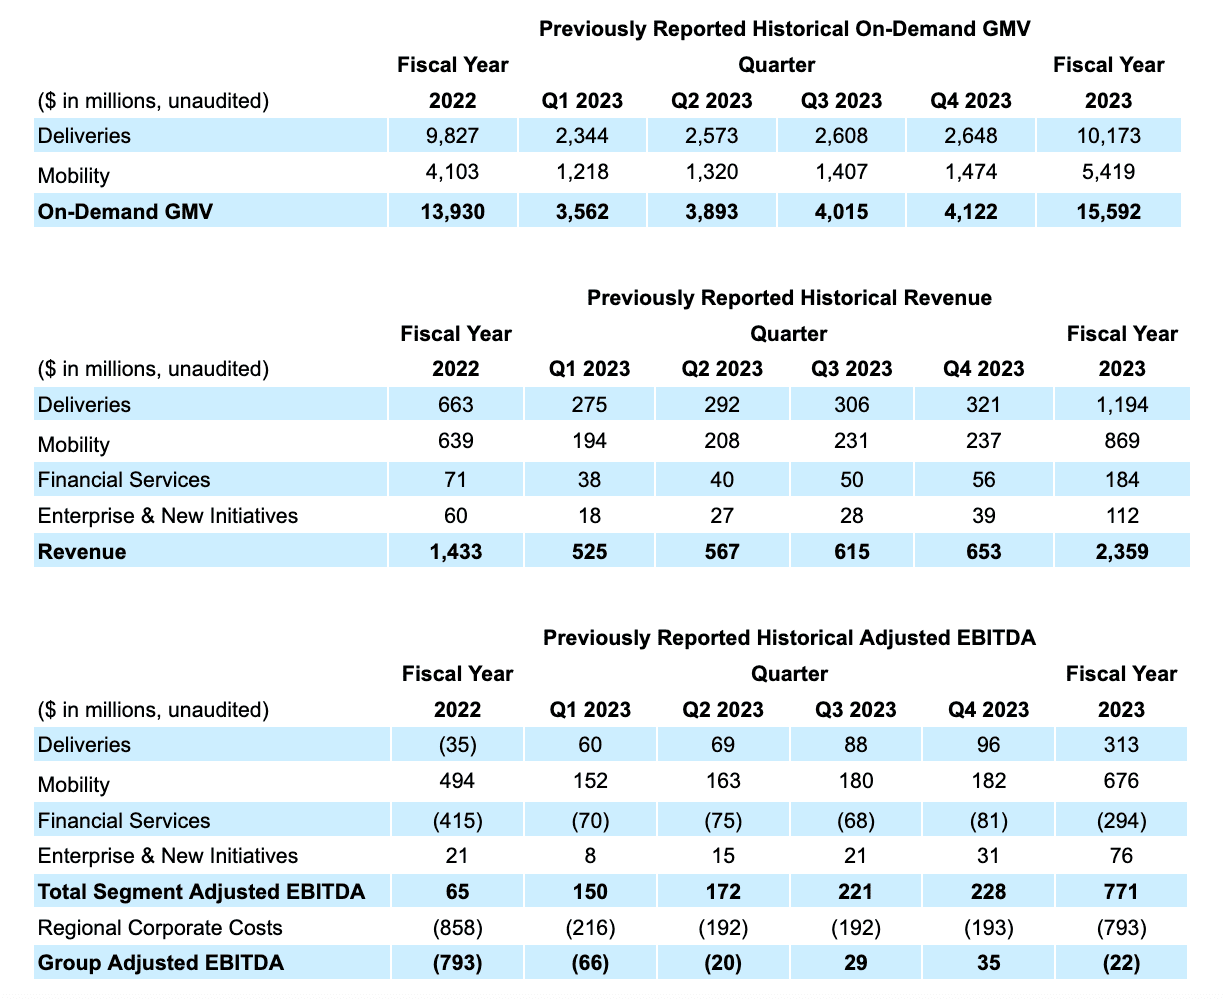
For reference, segment results as previously reported are as follows (in $ millions, unaudited):
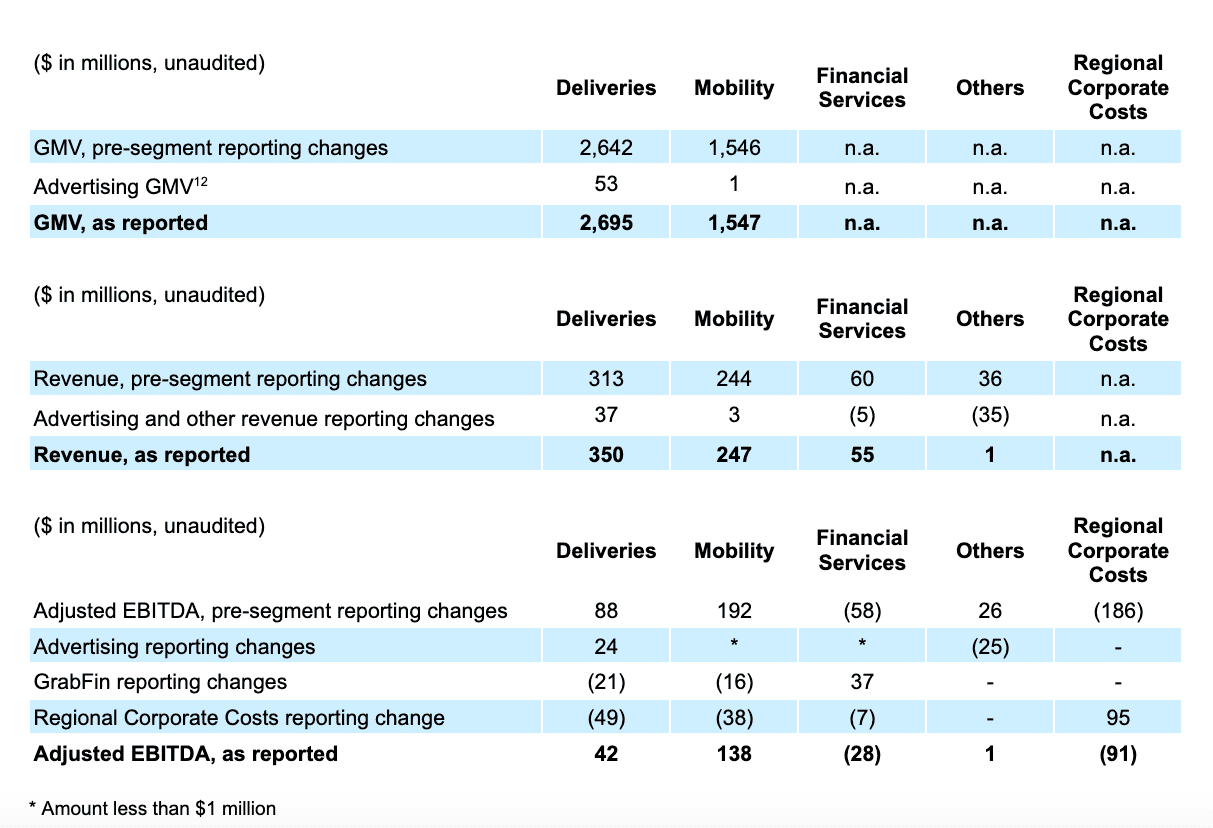
For reference, the following tables present our On-Demand GMV, revenues and Adjusted EBITDA in the first quarter of 2024, and detail the updates from the previous to the current segment reporting structure (in $ millions, unaudited):
Industry and Market Data
This document may contain information, estimates and other statistical data derived from third party sources , including research, surveys or studies, some of which are preliminary drafts, conducted by third parties, information provided by customers and/or industry or general publications. Such information involves a number of assumptions and limitations and due to the nature of the techniques and methodologies used in market research, and as such neither Grab nor the third-party sources can guarantee the accuracy of such information. You are cautioned not to give undue weight on such estimates. Grab has not independently verified such third-party information, and makes no representation as to the accuracy of such third-party information.
Unaudited Summary of Financial Results
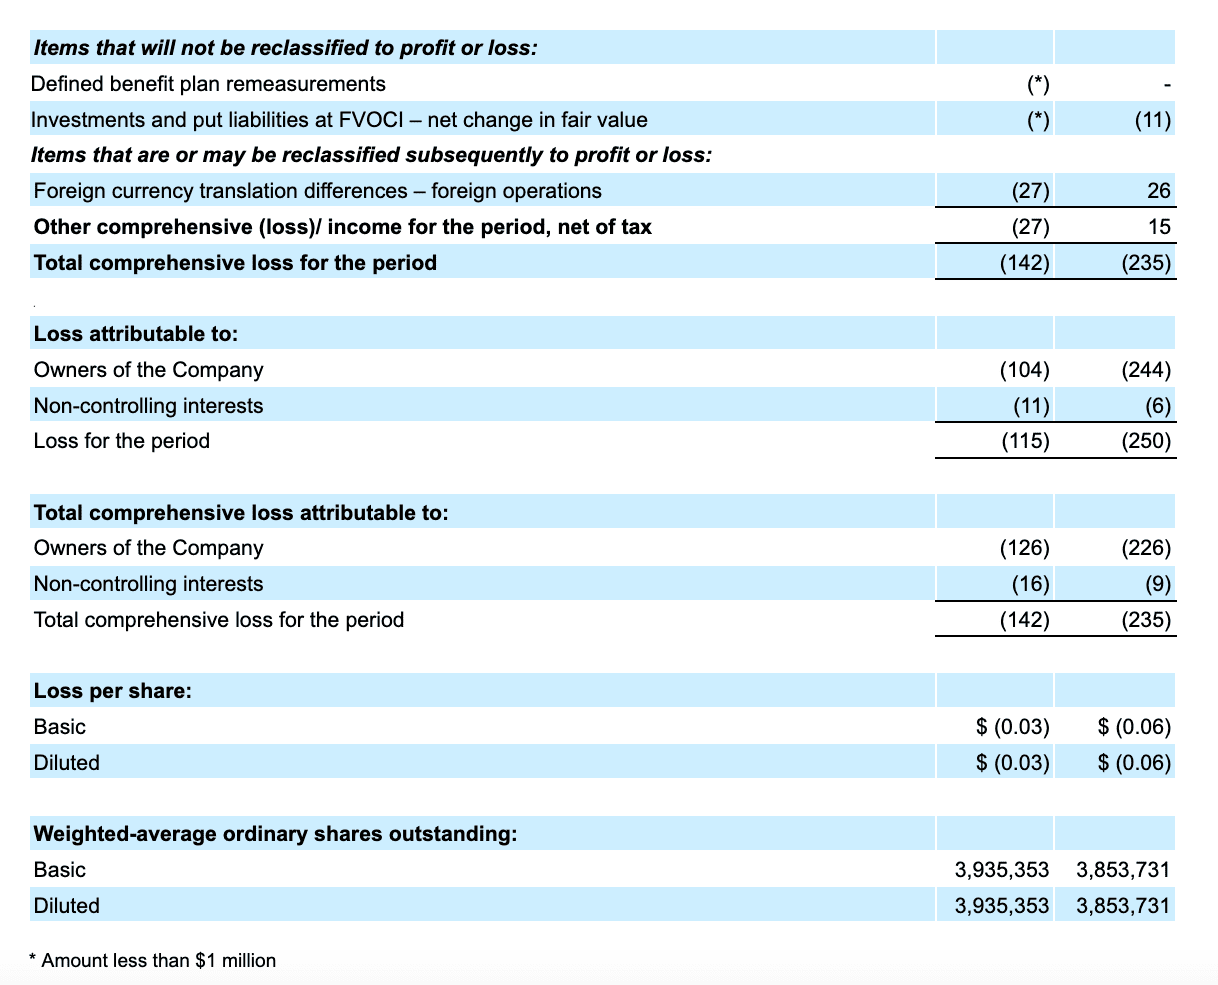
As we incurred a net loss for the three months ended March 31, 2024, basic loss per share was the same as diluted loss per share.
The number of outstanding Class A and Class B ordinary shares was 3,840 million and 113 million as of March 31, 2024, and 3,784 million and 103 million, respectively, as of March 31, 2023. 379 million and 397 million potentially dilutive outstanding securities were excluded from the computation of diluted loss per ordinary share because their effects would have been antidilutive for the three months ended March 31, 2024 and 2023 respectively, or issuance of such shares is contingent upon the satisfaction of certain conditions which were not satisfied by the end of the period.
[1] The financial results in this earnings release have been updated to reflect the segment reporting changes. As disclosed in our Q4 2023 earnings release, our financial results beginning with the first quarter 2024 earnings release reflect certain segment reporting changes. See the section headed “Segment Reporting Changes” for details.
[2] We consider Mobility and Deliveries segments to represent our On-Demand businesses. On-Demand GMV is defined as the sum of Mobility and Deliveries GMV.
[3] The total of current and non-current loan receivables in the financial services segment, net of expected credit loss allowances.
[4] We calculate constant currency by translating our current period financial results using the corresponding prior period’s monthly exchange rates for our transacted currencies other than the U.S. dollar.
[5] Regional corporate costs are costs that are not attributed to any of the business segments, including certain cost of revenue, research and development expenses, general and administrative expenses and marketing expenses. These regional costs of revenue include cloud computing costs. These regional research and development expenses also include mapping and payment technologies and support and development of the internal technology infrastructure. These general and administrative expenses also include certain shared costs such as finance, accounting, tax, human resources, technology and legal costs. Regional corporate costs exclude share-based compensation expenses and capitalized software costs.
[6] Cash liquidity includes cash on hand, time deposits, marketable securities and restricted cash.
[7] Net cash liquidity includes cash liquidity less loans and borrowings.
[8] Includes completed food and groceries transactions
[9] Earnings per transit hour across both Mobility and Deliveries.
[10] Surged Mobility rides are defined as completed rides where demand exceeds supply in a specified region and/or where pricing regulations adherence is required.
[11] Total Payments Volume (TPV) means total payments volume received from consumers, which is an operating metric defined as the value of payments, net of payment reversals, successfully completed through our platform.